Chart Widget
Use this widget in order to render charts based off of the JQL widget.
Fields
Chart Title
A simple name you want to provide to the chart.
Chart Source
This is where you specify the JQL widget you want to use to populate the chart.
Chart Type
Currently we support the following charts:
- Line
- Bar
- Pie
With more to come in future releases!
X-Axis
The column we want to use to represent the values in the X-Axis
Series
Select 1 or more series. Each series will represent a graph within the chart. The columns defined in here should typically be columns defined via Aggregations or any numerical column.
Example
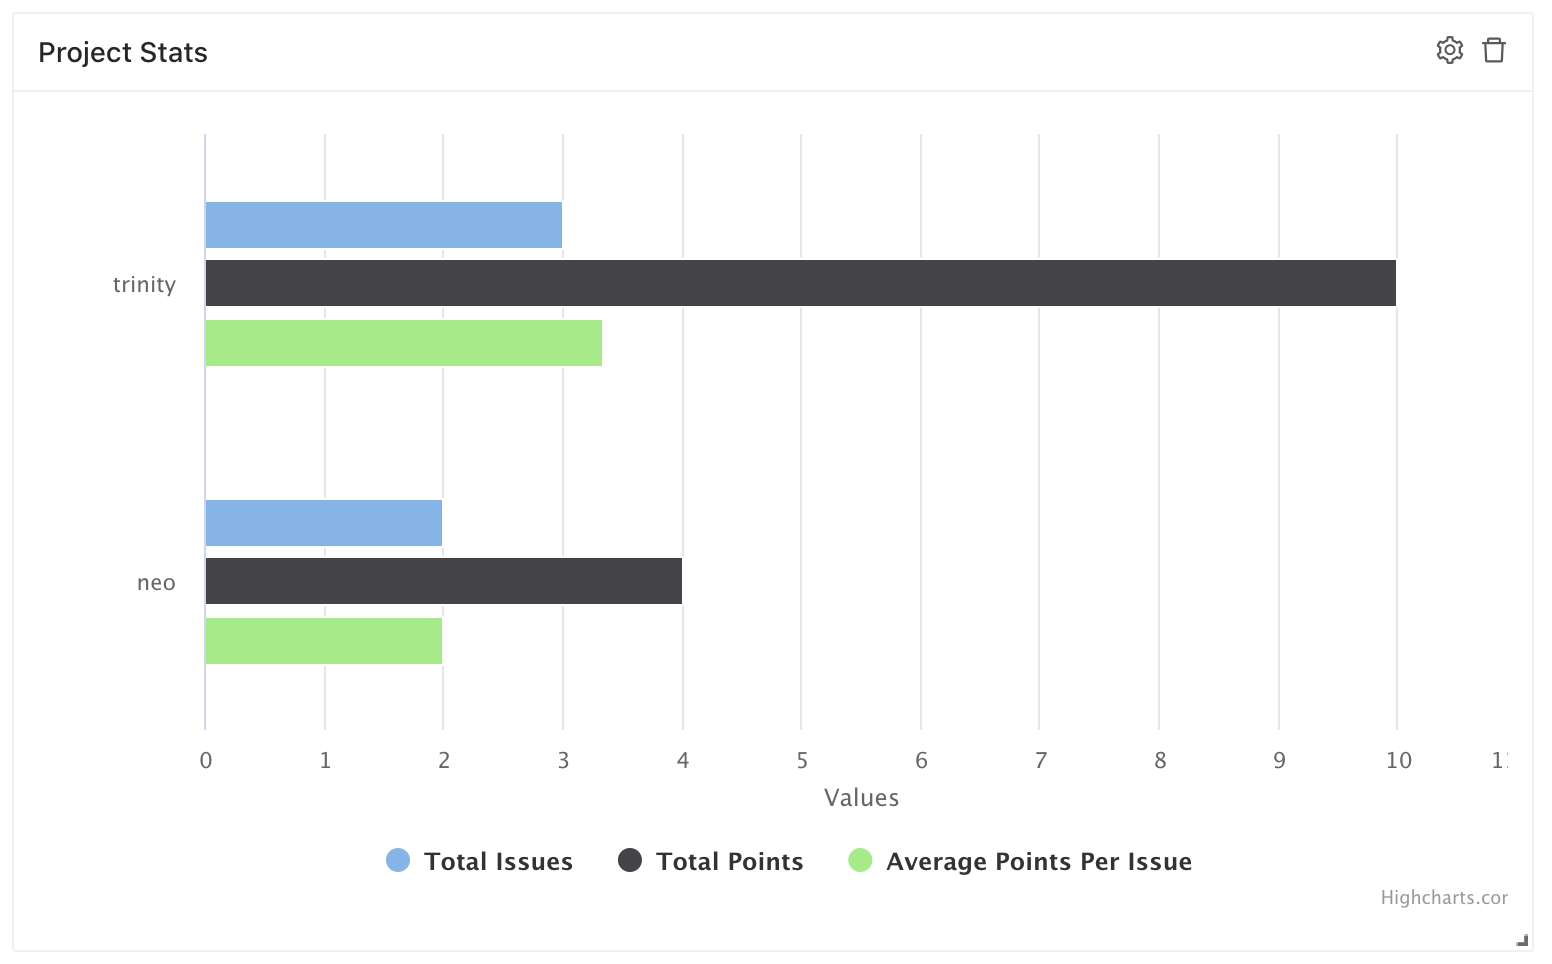
If we use the table output from the JQL Example and wanted to generate a bar chart
with X-Axis set to Project with 3 series:
- Total Issues
- Total Points
- Average Points Per Issue
We would see this graph:
tip
For pie charts, only the first series is applied.
Slice By
If there's multiple values with the same X-Axis label in a series, the default behaviour is to do a sum across the rows.
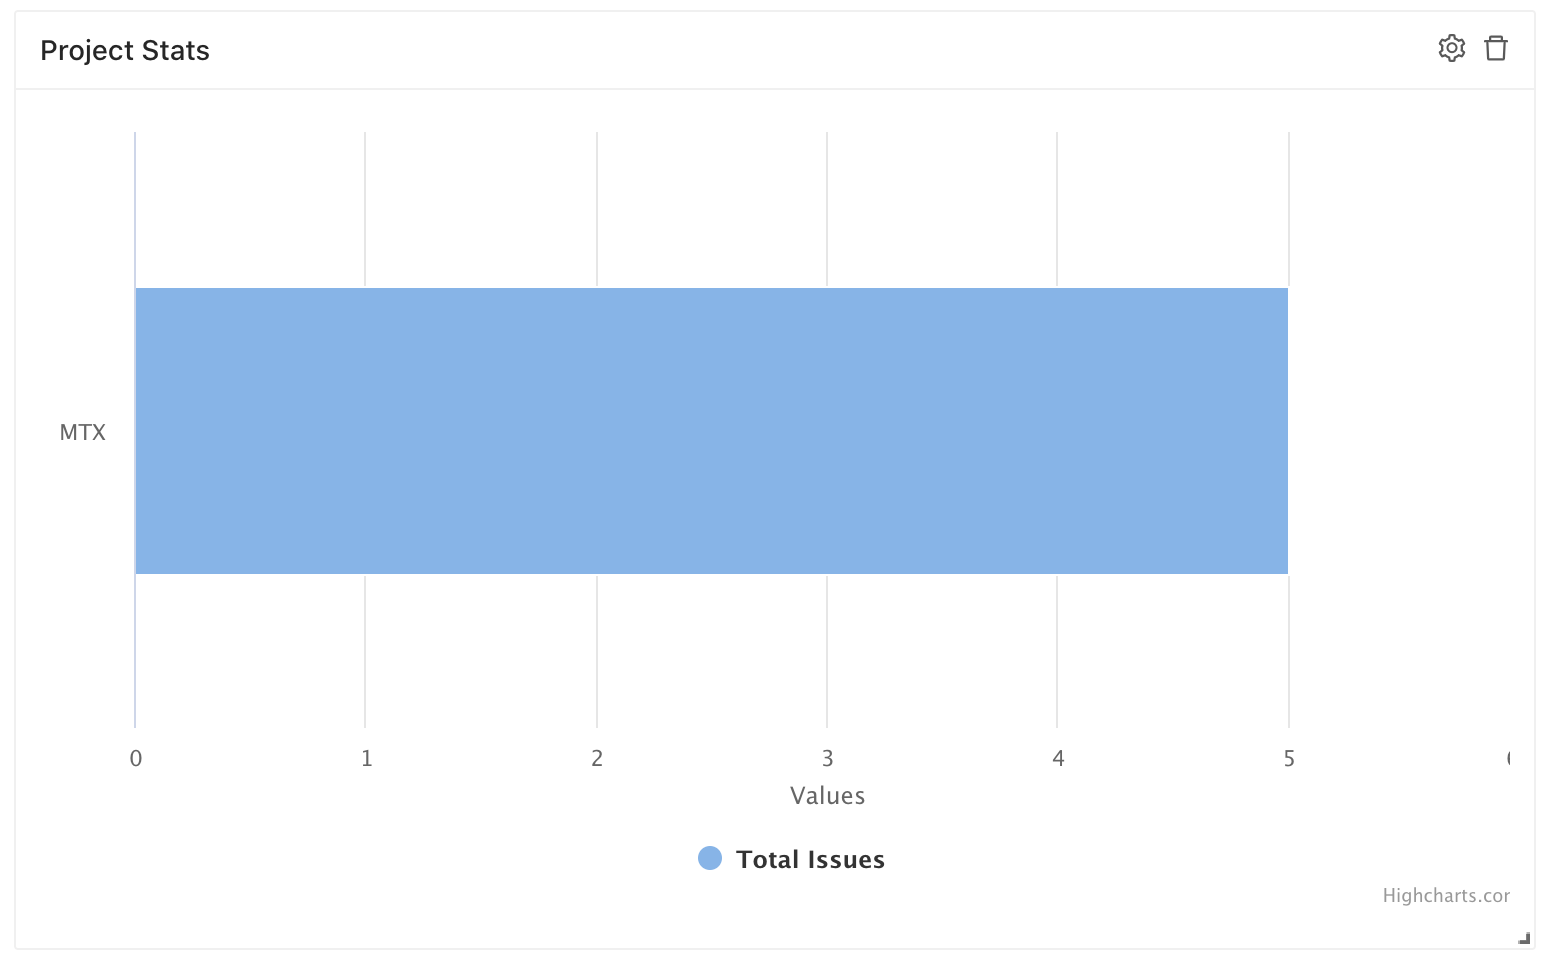
Here is what would happen if we specify the X-Axis to be Project and only have 1 series set to Total Issues.
However if we choose to add a Slice By of Assignee we get this instead:
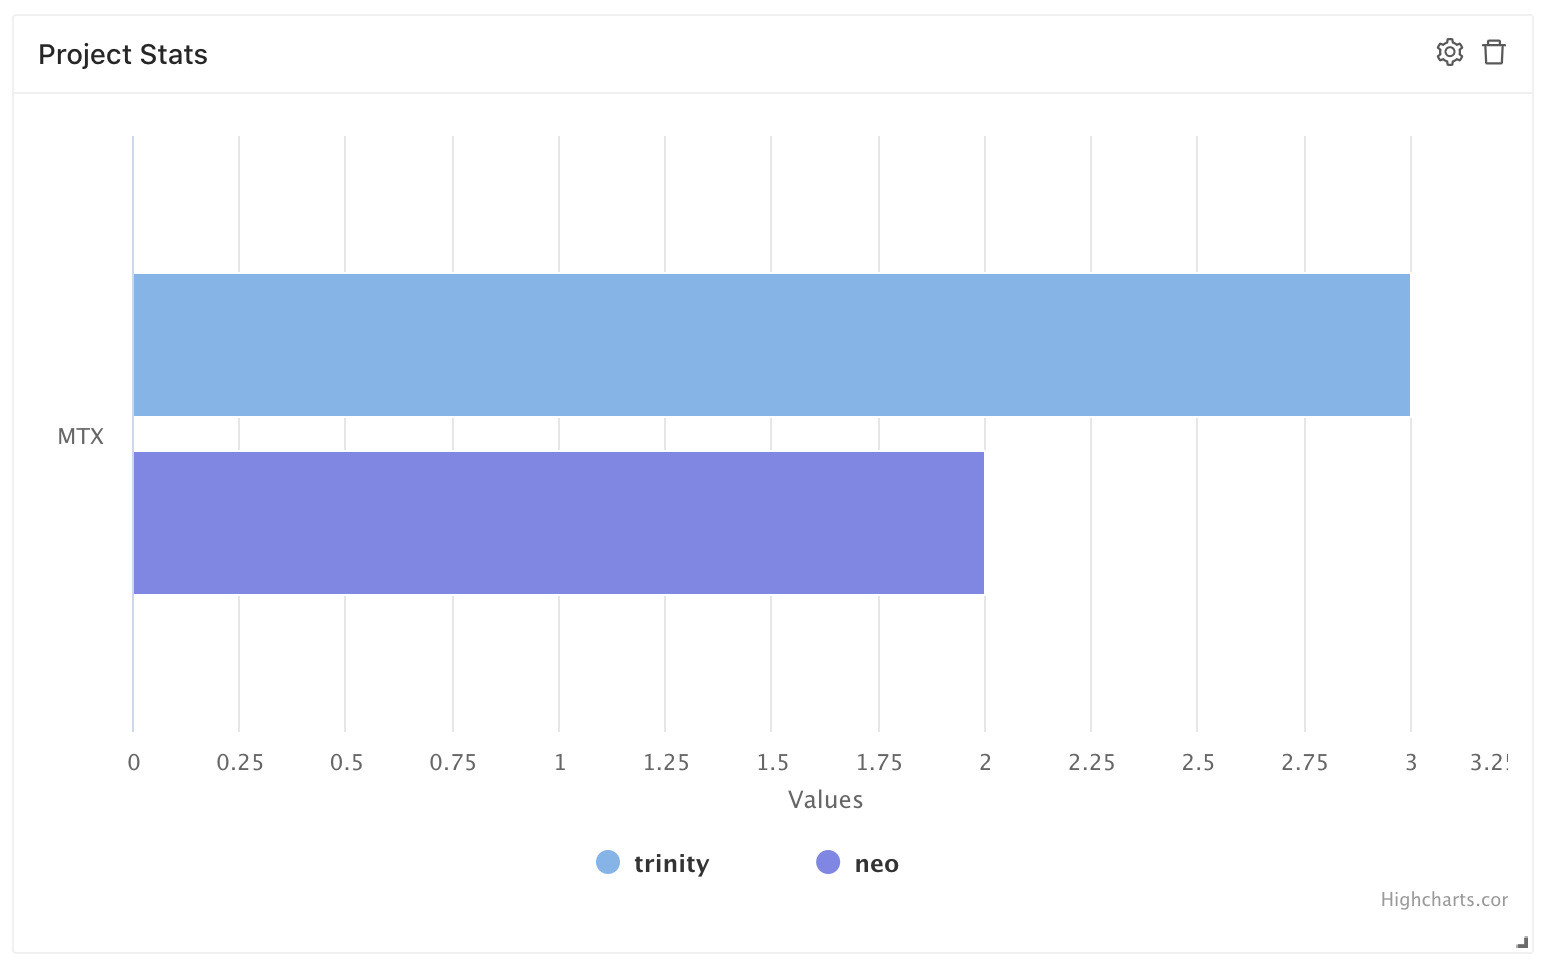
Slice By is incredibly useful for automatically generating multiple graphs across your JQL data without duplicating work.