JQL Widget
Use this widget in order to display Jira issues in a tabular form. You can then use this widget in order to generate charts.
Fields
In order to create a JQL widget we need the following fields.
Name
Describes what this JQL widget represents so that it can be referenced in other widgets (e.g. chart widget)
JQL
JQL: An advanced way to query for issues. Read more here
Group By
A way to filter for distinct values within the results outputted by the JQL
Say we have the following table:
| Project | Assignee | Issue Key | Estimate |
|---|---|---|---|
| MTX | neo | MTX-1 | 1 |
| MTX | neo | MTX-2 | 3 |
| MTX | trinity | MTX-3 | 5 |
And we set the Group By to be Project. We would see a table output of:
| Project |
|---|
| MTX |
This is because MTX is the only unique value we have in that column.
If we set Group By to be Assignee we would get:
| Assignee |
|---|
| neo |
| trinity |
And if we set Group By to be both Project and Assignee then we would get:
| Project | Assignee |
|---|---|
| MTX | neo |
| MTX | trinity |
This is because the uniqueness is now being applied across both columns. Each individual row itself is unique.
Aggregations
A way to make calculations across distinct rows.
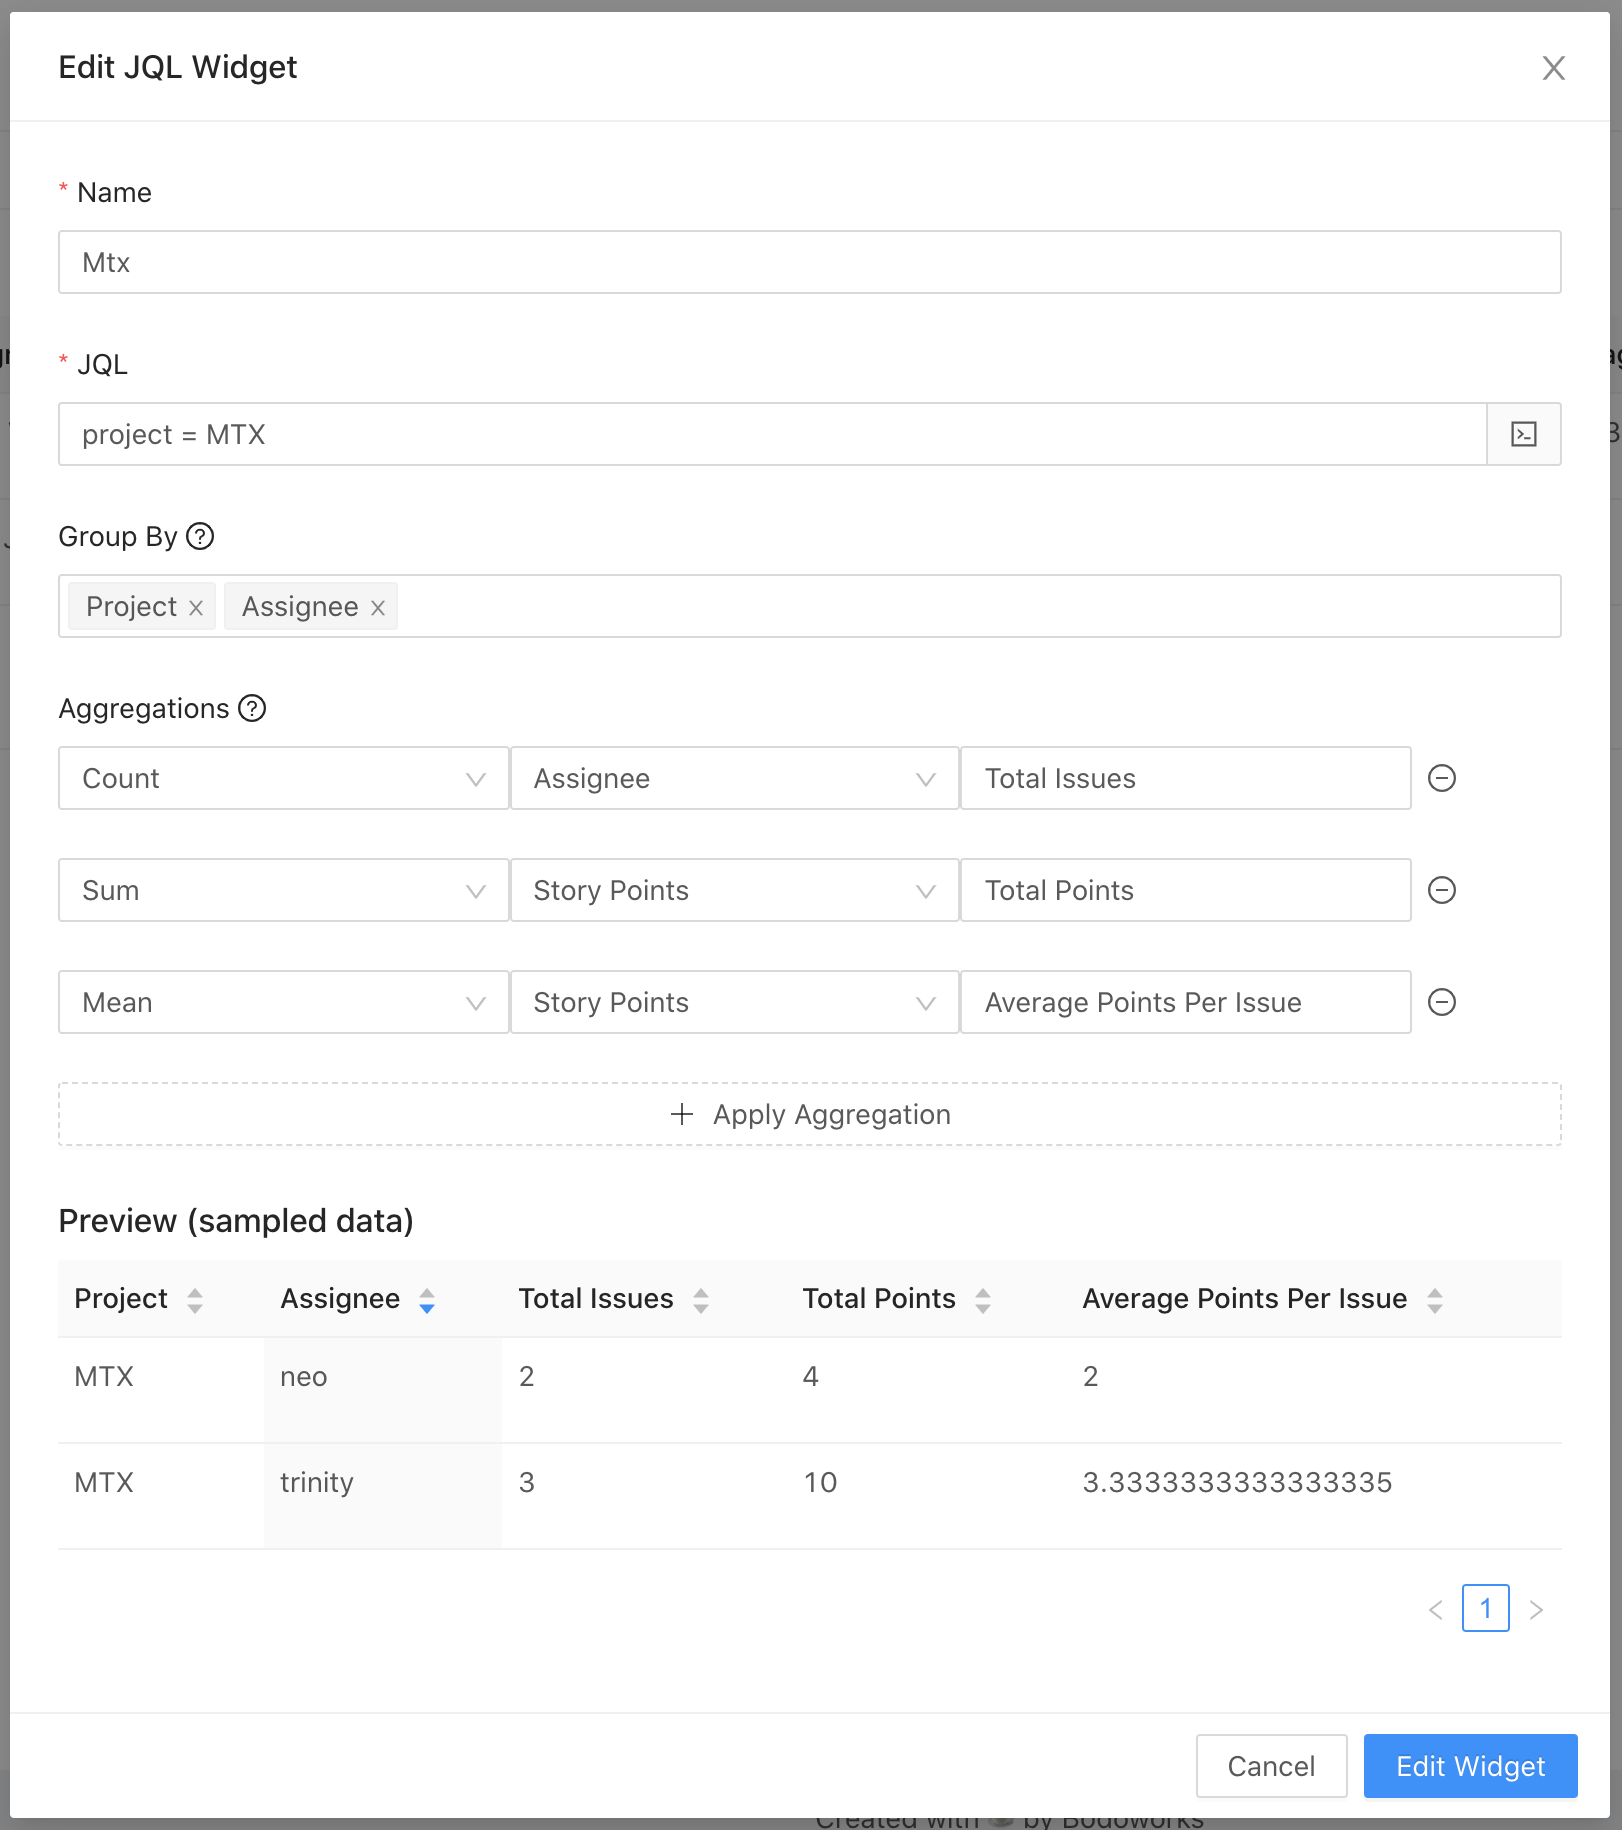
Let's say we want to find out how many story points each user within a project is assigned, how many issues are assigned, and also the average estimate of each ticket.
Say our table is:
| Project | Assignee | Issue Key | Estimate |
|---|---|---|---|
| MTX | neo | MTX-1 | 1 |
| MTX | neo | MTX-2 | 3 |
| MTX | trinity | MTX-3 | 5 |
| MTX | trinity | MTX-4 | 3 |
| MTX | trinity | MTX-5 | 2 |
If we added 3 aggregations:
- COUNT,
Assginee,Total Issues - SUM,
Estimate,Total Points - MEAN,
Estimate,Average Points Per Issue
Then we would see:
| Project | Assignee | Total Issues | Total Points | Average Points Per Issue |
|---|---|---|---|---|
| MTX | neo | 2 | 4 | 2 |
| MTX | trinity | 3 | 10 | 3.3333333 |
It becomes obvious that Trinity is actually the one that's carrying the team in this project.
Example
The end result is something like this: